
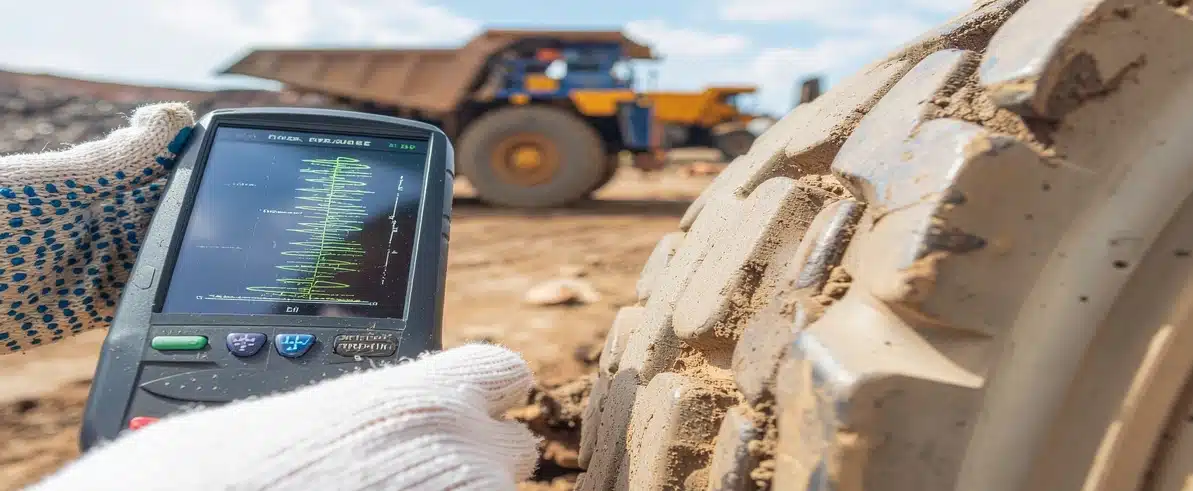
A failed bearing in a haul truck transmission doesn’t just stop one vehicle. It halts production, triggers emergency repairs, and often damages surrounding components that would have remained serviceable. In mining and heavy transport operations, where equipment availability directly determines revenue, catastrophic failures represent the worst possible outcome. Vibration data analysis exists specifically to prevent this scenario by identifying bearing and gear faults weeks or months before they reach failure threshold.
Why Early Detection Matters in Heavy Industrial Operations
The True Cost of a Catastrophic Bearing or Gear Failure
When a bearing fails catastrophically, the repair timeline extends beyond the bearing replacement itself. Metal debris circulates through lubrication systems, gear teeth suffer impact damage from sudden load shifts, and housings crack from the vibration spike that precedes total failure.
A bearing replacement during scheduled maintenance costs the bearing, labour, and planned downtime. The same bearing replaced after catastrophic failure adds gearbox rebuild costs, contaminated oil disposal, housing repairs, and emergency labour rates — often reaching many times the planned maintenance cost. The financial case for predictive maintenance monitoring is straightforward: intervention during a scheduled window costs a fraction of post-failure emergency repair.
How Standard Scheduled Maintenance Falls Short
Scheduled maintenance based on operating hours provides some protection, but replaces components with remaining service life whilst missing defects developing between inspection intervals. Predictive maintenance monitoring through vibration data analysis identifies the actual condition of rotating components, enabling intervention when early-stage faults appear rather than waiting for scheduled intervals or reacting to complete failures.
How Vibration Data Analysis Works
Every rotating component generates vibration. Healthy bearings and gears produce consistent, predictable vibration patterns at frequencies determined by rotational speed, tooth count, and geometry. When defects develop, they create additional vibration frequencies — spectral fault signatures — that shouldn’t exist in properly functioning equipment.
The Physics Behind Bearing Vibration Frequencies
A bearing with a defect on its outer race generates an impact each time a rolling element passes the damaged area. That impact occurs at a specific frequency calculated from bearing geometry: the ball pass frequency outer race (BPFO). Similarly, inner race defects, rolling element damage, and cage wear each produce distinct frequencies — BPFI, BSF, and FTF respectively.
Vibration amplitude indicates severity. A small pit on a bearing race might generate a modest peak at BPFO. As the pit expands into spalling, amplitude increases progressively as the defect propagates. EIG tracks this progression across measurement intervals to forecast when amplitude will reach the failure threshold for industrial bearings, enabling replacement to be scheduled during the next available maintenance window.
Spectral Fault Signatures in Gear Vibration
Gear mesh frequency represents the rate at which gear teeth engage. A gear rotating at a given speed generates a base mesh frequency determined by tooth count and RPM. Tooth wear, pitting, or misalignment creates sidebands around this base frequency — additional peaks spaced at the shaft rotation frequency that indicate which specific gear carries the defect.
These spectral fault signatures in gear vibration allow analysts to distinguish between tooth wear (regular sidebands at shaft frequency), eccentric gears (strong 1x shaft speed sidebands), pitting or spalling (raised high-frequency noise floor), and shaft misalignment (elevated axial vibration at 1x and 2x shaft speed). Each pattern directs repair planning to the correct fault type before failure occurs.
Data Collection and Sensor Placement
Accelerometer Positioning and Sampling Requirements
Accelerometers mounted on bearing housings measure vibration in three axes: radial horizontal, radial vertical, and axial. Sensor placement matters critically. A sensor mounted on a gearbox housing far from the bearing will detect lower amplitude than one placed directly on the bearing cap, potentially missing early-stage faults.
Permanent monitoring systems use wired accelerometers connected to data acquisition hardware that samples continuously or at programmed intervals. Route-based monitoring uses handheld data collectors that technicians position at marked measurement points during scheduled rounds. Sampling rates must exceed twice the highest frequency of interest — typically 20 to 50 kHz for bearing fault detection systems — capturing the high-frequency content where incipient faults first become detectable.
Acoustic Emission Testing for Ultra-Early Detection
Standard vibration analysis detects faults once they generate sufficient energy in the standard frequency range. Acoustic emission testing operates at much higher frequencies, detecting the stress waves generated when microscopic cracks propagate in bearing races or gear tooth subsurfaces.
A crack extending through a bearing race releases energy as an elastic stress wave travelling through the steel at speed. Piezoelectric sensors detect these high-frequency transient signals hours or days before the crack becomes large enough to generate detectable vibration in the standard frequency range. This advance warning proves particularly valuable for bearings in inaccessible locations where route-based monitoring is impractical, or in applications where even brief warning periods justify the additional sensor cost. Finite element analysis can model stress distributions in custom mounting configurations to optimise acoustic emission sensor placement for maximum sensitivity.
Acoustic emission testing requires more sophisticated signal processing than standard vibration analysis. Effective systems use pattern recognition algorithms to distinguish fault-related acoustic emissions from operational noise, electromagnetic interference, and mechanical impacts from adjacent equipment.
Bearing Fault Detection Systems in Practice
Four Bearing Defect Types and Their Frequency Signatures
Four primary bearing defect types each generate distinct vibration frequencies. Outer race defects create impacts at BPFO — the calculated frequency based on bearing geometry. Defects appear as peaks at this frequency and its harmonics. Inner race defects generate BPFI, typically higher than BPFO because the inner race rotates with the shaft whilst the outer race remains stationary. Rolling element defects create BSF peaks, usually at lower frequencies than race defects. Cage defects appear at FTF, typically the lowest bearing-related frequency.
Bearing fault detection systems compare measured spectra against calculated bearing frequencies for the specific bearing installed. When spectral fault signatures appear at predicted fault frequencies, the system flags the bearing for further analysis. Amplitude trending over time indicates whether the defect is stable, slowly progressing, or rapidly deteriorating.
Gear Fault Detection Through Frequency Analysis
Gear mesh frequency appears as the dominant peak in gearbox vibration spectra. For healthy gears, mesh frequency amplitude remains stable with minimal sidebands. Developing faults create characteristic sideband patterns. Tooth wear generates sidebands spaced at shaft rotational frequency on both sides of gear mesh frequency. Tooth pitting or spalling creates impulsive impacts that excite high-frequency resonances, appearing as raised noise floors rather than discrete peaks. Misalignment between gear shafts generates axial vibration at 1x and 2x shaft speed with elevated mesh frequency amplitude.
Predictive Maintenance Monitoring Integration
Condition monitoring services deliver value when vibration data drives maintenance decisions rather than simply documenting equipment condition. Integration with workshop installation services and on-site installation support creates a closed loop where detection leads directly to intervention.
Three-Tier Alert Thresholds and Maintenance Response
Effective integration requires alert thresholds set at multiple levels that trigger appropriate responses. A bearing vibration reaching a caution threshold schedules inspection during the next planned maintenance window. An alert threshold brings forward the maintenance window. A danger threshold triggers immediate shutdown and repair.
EIG integrates vibration data analysis with electrical engineering solutions for fleet management system installations, enabling automated alert distribution and maintenance work order generation when threshold exceedances occur.
Trend Analysis and Parts Procurement Timing
Trend analysis plots vibration amplitude over time, revealing fault progression rates. A bearing showing steady monthly amplitude increase will reach failure threshold in a predictable timeframe, enabling parts procurement and maintenance scheduling before emergency intervention becomes necessary.
Baseline establishment during commissioning or after major repairs creates the reference spectrum representing healthy operation. All subsequent measurements compare against this baseline to identify emerging spectral fault signatures at their earliest stage.
From Detection to Action
Spectrum Interpretation and Intervention Planning
Vibration data becomes actionable through systematic interpretation and response protocols. Spectrum analysis identifies fault type and location. Trending indicates urgency. Maintenance planning determines optimal intervention timing considering operational requirements, parts availability, and resource allocation.
A bearing showing early outer race defect with slow progression might continue operating for many hundreds of hours before reaching replacement threshold. If the vehicle is scheduled for major service within that window, the bearing replacement integrates into that service. If progression accelerates unexpectedly, continuous monitoring detects the change and advances the intervention schedule.
Documentation and Fleet-Wide Learning
Documentation matters. Each measurement creates a data point in the equipment history. Over time, this history reveals patterns: specific bearing positions that consistently fail early indicate design issues or installation problems. Certain operating profiles that accelerate wear inform operational modifications. Maintenance intervals optimised based on actual wear rates rather than manufacturer estimates.
For mining operations managing large vehicle fleets across multiple sites, workshop-based installation services can rebuild components identified through remote vibration monitoring, whilst field teams handle urgent repairs at site.
Conclusion
That outcome — planned replacement instead of catastrophic failure — represents the entire purpose of vibration data analysis. The technology, the sensors, the signal processing, and the expertise all serve one goal: detecting problems whilst they remain small, manageable, and repairable during scheduled maintenance rather than discovering them during emergency breakdowns.
For operations where equipment availability determines profitability, early detection isn’t a secondary concern — it’s the difference between controlling maintenance costs and letting failures control the maintenance schedule. To discuss how condition monitoring services integrate with your fleet maintenance programme, call +61 (08) 9419 7318 to speak with the technical team.



Leave A Comment